Layered Metrics in Multi-Sport Analysis: Horse Racing, Football, and Tennis Indicators for Market Layering
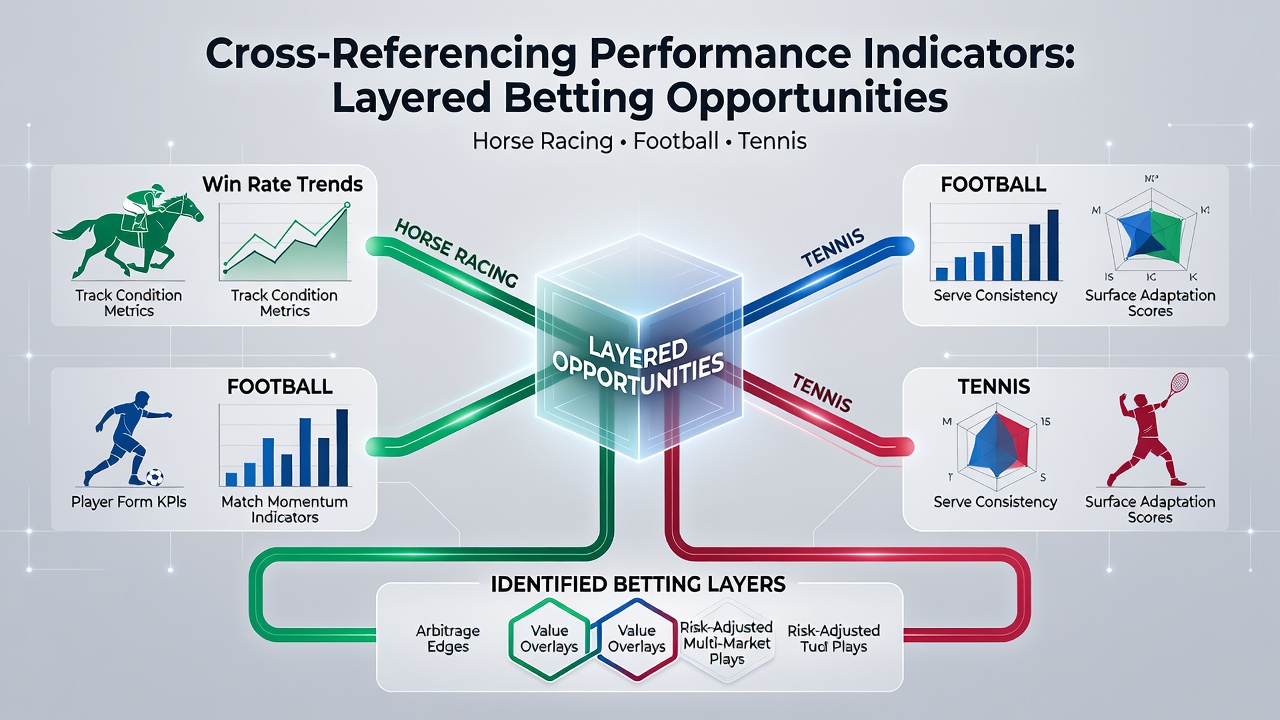
Analysts examine performance indicators across horse racing, football, and tennis to build layered approaches in betting markets, and data from multiple disciplines often reveals patterns that single-sport reviews miss. In July 2026, tracking systems continue to integrate speed ratings from tracks, possession metrics from pitches, and serve percentages from courts into unified models that operators and researchers monitor for market movements.
Core Indicators in Each Discipline
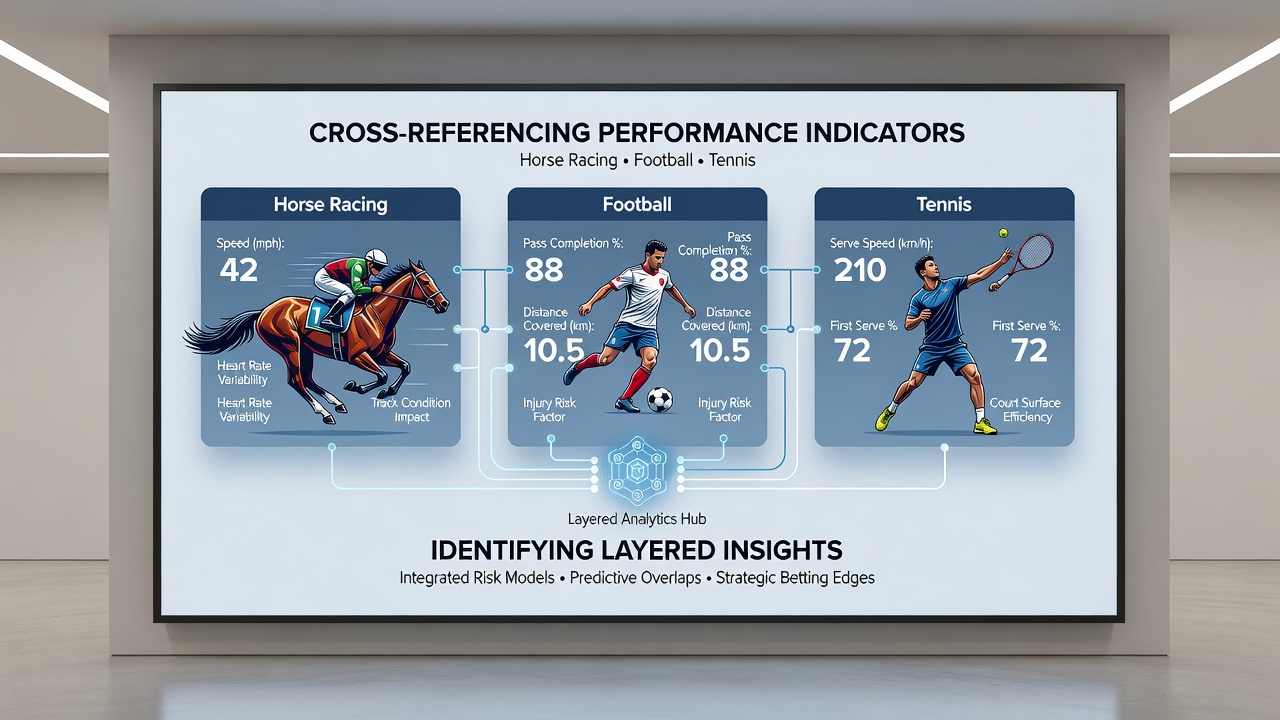
Horse racing provides speed figures, sectional times, and going adjustments that researchers compile from events at venues such as Ascot and Flemington; these figures feed into pace maps that show how early leaders or closers perform under specific conditions. Football contributes expected goals, progressive passes, and set-piece conversion rates drawn from league databases, while tennis supplies first-serve points won, break-point efficiency, and surface-specific win rates that statisticians record from ATP and WTA tournaments. When observers align these datasets, they identify correlations such as how a football team's high progressive-pass volume in wet conditions mirrors the impact of soft ground on equine sectional times.
Cross-Referencing Techniques
Researchers apply normalization methods to place indicators on comparable scales, converting tennis ace percentages into equivalent "advantage margins" that align with football shot-creation values or horse racing speed ratings. Software platforms aggregate these adjusted numbers, allowing queries that flag instances where, for example, a tennis player's clay-court break-point rate exceeds league averages in the same week that a football side records elevated expected-goals differentials on similar surfaces. Data from the 2025-2026 season shows increased use of such alignment tools during overlapping tournament windows, including Wimbledon and the European club season.
Layer Construction in Practice
Market participants construct layers by sequencing indicators so that one sport's output becomes an input filter for the next. A model might first screen horse racing fields for horses with superior late sectional times on firm ground, then cross-check those dates against football fixtures where teams exhibit strong second-half expected-goals trends, and finally overlay tennis matches where players maintain high first-serve win rates on comparable court speeds. This sequencing produces multi-leg structures that analysts track for deviation from market-implied probabilities. Reports from the Nevada Gaming Control Board indicate steady growth in multi-sport product offerings that accommodate such sequenced selections through 2026.
One documented case involved a series of meetings where analysts noted that horses recording sub-11-second furlong splits on good ground coincided with football clubs posting above-median recovery metrics after midweek European ties, and these periods overlapped with tennis events on medium-paced hard courts. The resulting layered selections drew attention from data teams monitoring line movement across operators.
Regulatory and Data Environment in Mid-2026
Regulators in multiple jurisdictions require operators to maintain transparent records of multi-sport products, and the Australian Communications and Media Authority has published updated guidelines on data disclosure for combined wagering platforms. Academic work from the University of Sydney's gambling research unit examines how cross-sport indicator models affect market liquidity, noting that transparent data feeds reduce information asymmetry during overlapping events. Industry bodies such as the European Gaming and Betting Association track adoption rates of unified analytics suites, reporting that participation among licensed operators rose through the first half of 2026.
These frameworks encourage standardized metric definitions, which in turn support more consistent cross-referencing. Observers note that clearer definitions allow models to incorporate variables such as travel fatigue across tennis tours and fixture congestion in football without introducing unmeasured bias.
Conclusion
Cross-referencing performance indicators from horse racing, football, and tennis supplies analysts with structured inputs for layered market strategies. The process relies on normalized datasets, sequenced filters, and transparent regulatory environments that together shape how operators present and monitor multi-sport selections through 2026 and beyond. Continued refinement of these methods depends on consistent data standards and ongoing collaboration between statistical teams and oversight bodies across regions.